- View project insights
- Configure project insights
- Insights configuration file
- Insights configuration parameters
- Complete insights configuration example
Insights for projects
Configure project insights to explore data such as:
- Issues created and closed during a specified period.
- Average time for merge requests to be merged.
- Triage hygiene.
Insights are also available for groups.
View project insights
Prerequisites:
- You must have:
- Access to a project to view information about its merge requests and issues.
- Permission to view confidential merge requests and issues in the project.
To view project insights:
- On the top bar, select Main menu > Projects and find your project.
- On the left sidebar, select Analytics > Insights.
- To view a report, select the Select report dropdown list.
Configure project insights
Prerequisites:
- Depending on your project configuration, you must have at least the Developer role.
Project insights are configured with the .gitlab/insights.yml file in the project. If a project doesn’t have a configuration file, it uses the group configuration.
The .gitlab/insights.yml file is a YAML file where you define:
- The structure and order of charts in a report.
- The style of charts displayed in the report of your project or group.
To configure project insights, either:
- Create a
.gitlab/insights.ymlfile locally in the root directory of your project, and push your changes. - Create a
.gitlab/insights.ymlfile in the UI:- On the top bar, select Main menu > Projects and find your project.
- Above the file list, select the branch you want to commit to, select the plus icon, then select New file.
- In the File name text box, enter
.gitlab/insights.yml. - In the large text box, update the file contents.
- Select Commit changes.
After you create the configuration file, you can also use it for the project’s group.
Insights configuration file
In the .gitlab/insights.yml file:
- Configuration parameters define the chart behavior.
- Each report has a unique key and a collection of charts to fetch and display.
- Each chart definition is made up of a hash composed of key-value pairs.
The following example shows a single definition that displays one report with one chart.
bugsCharts:
title: "Charts for bugs"
charts:
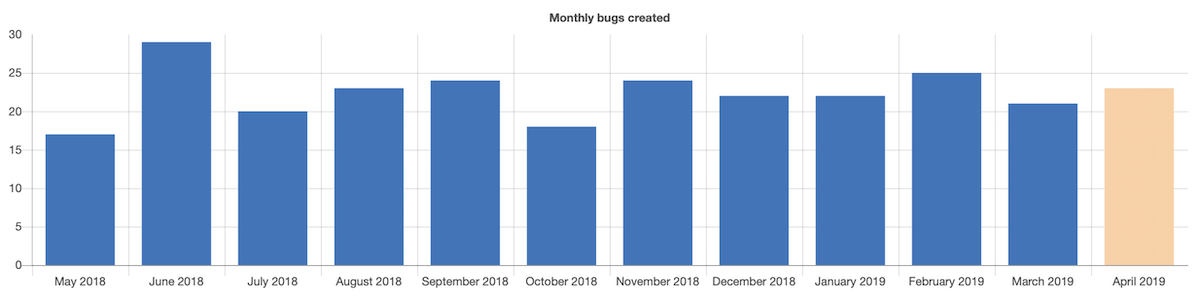
- title: "Monthly bugs created"
description: "Open bugs created per month"
type: bar
query:
data_source: issuables
params:
issuable_type: issue
issuable_state: opened
filter_labels:
- bug
group_by: month
period_limit: 24
Insights configuration parameters
The following table lists the chart parameters:
| Keyword | Description |
|---|---|
title
| The title of the chart. This displays on the Insights page. |
description
| A description for the individual chart. This displays above the relevant chart. |
type
| The type of chart: bar, line or stacked-bar.
|
query
| A hash that defines the data source and filtering conditions for the chart. |
title
Use title to update the chart title. The title displays on the insights report.
Example:
monthlyBugsCreated:
  title: "Monthly bugs created"
description
Use description to add a description of the chart. The description displays above the chart, below the title.
Example:
monthlyBugsCreated:
  title: "Monthly bugs created"
  description: "Open bugs created per month"
type
Use type to define the chart type.
Supported values:
| Name | Example: |
|---|---|
bar
| 
|
bar (time series, that is when group_by is used)
| 
|
line
| 
|
stacked-bar
| 
|
The dora data source supports the bar and line chart types.
Example:
monthlyBugsCreated:
  title: "Monthly bugs created"
  type: bar
query
Use query to define the data source and filtering conditions for the chart.
Example:
monthlyBugsCreated:
  title: "Monthly bugs created"
  description: "Open bugs created per month"
  type: bar
  query:
    data_source: issuables
    params:
      issuable_type: issue
      issuable_state: opened
      filter_labels:
        - bug
      collection_labels:
        - S1
        - S2
        - S3
        - S4
      group_by: week
      period_limit: 104
The legacy format without the data_source parameter is still supported:
monthlyBugsCreated:
  title: "Monthly bugs created"
  description: "Open bugs created per month"
  type: bar
  query:
    issuable_type: issue
    issuable_state: opened
    filter_labels:
      - bug
    collection_labels:
      - S1
      - S2
      - S3
      - S4
    group_by: week
    period_limit: 104
query.data_source
Introduced in GitLab 15.3.
Use data_source to define the data source that exposes the data.
Supported values:
-
issuables: Exposes merge request or issue data. -
dora: Exposes DORA metrics.
issuable query parameters
query.params.issuable_type
Use query.params.issuable_type to define the type of issuable to create a chart for.
Supported values:
-
issue: The chart displays issues’ data. -
merge_request: The chart displays merge requests’ data.
query.params.issuable_state
Use query.params.issuable_state to filter by the current state of the queried issuable.
By default, the opened state filter is applied.
Supported values:
-
opened: Open issues or merge requests. -
closed: Closed issues or merge requests. -
locked: Issues or merge requests that have their discussion locked. -
merged: Merged merge requests. -
all: Issues or merge requests in all states.
query.params.filter_labels
Use query.params.filter_labels to filter by labels applied to the queried issuable.
By default, no label filter is applied. All defined labels must be applied to the issuable for it to be selected.
Example::
monthlyBugsCreated:
  title: "Monthly regressions created"
  type: bar
  query:
    data_source: issuables
    params:
      issuable_type: issue
      issuable_state: opened
      filter_labels:
        - bug
        - regression
query.params.collection_labels
Use query.params.collection_labels to group issuables by the configured labels.
Grouping is not applied by default.
When using this parameter, you must
set type to line or stacked-bar.
Example:
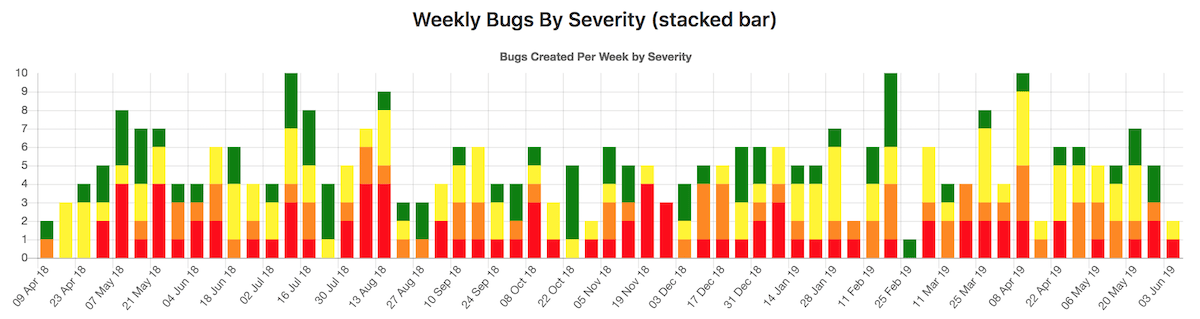
weeklyBugsBySeverity:
  title: "Weekly bugs by severity"
  type: stacked-bar
  query:
    data_source: issuables
    params:
      issuable_type: issue
      issuable_state: opened
      filter_labels:
        - bug
      collection_labels:
        - S1
        - S2
        - S3
        - S4
query.group_by
Use query.group_by to define the X-axis of the chart.
Supported values:
-
day: Group data per day. -
week: Group data per week. -
month: Group data per month.
query.period_limit
Use query.period_limit to define how far back in time to query issuables (using the query.period_field).
The unit is related to the value defined in query.group_by. For example, if you
defined query.group_by: 'day', and query.period_limit: 365, the chart displays data from the last 365 days.
By default, default values are applied depending on the query.group_by
you defined.
query.group_by
| Default value |
|---|---|
day
| 30 |
week
| 4 |
month
| 12 |
query.period_field
Use query.period_field to define the timestamp field by which to group issuables.
Supported values:
-
created_at(default): Group data using thecreated_atfield. -
closed_at: Group data using theclosed_atfield (for issues only). -
merged_at: Group data using themerged_atfield (for merge requests only).
The period_field is automatically set to:
-
closed_atifquery.issuable_stateisclosed -
merged_atifquery.issuable_stateismerged -
created_atotherwise
created_at in place of merged_at. created_at is used instead.
DORA query parameters
Introduced in GitLab 15.3.
Use DORA-specific queries with the dora data source to create a DORA chart definition.
Example:
dora:
  title: "DORA charts"
  charts:
    - title: "DORA deployment frequency"
      type: bar # or line
      query:
        data_source: dora
        params:
          metric: deployment_frequency
          group_by: day
          period_limit: 10
      projects:
        only:
          - 38
    - title: "DORA lead time for changes"
      description: "DORA lead time for changes"
      type: bar
      query:
        data_source: dora
        params:
          metric: lead_time_for_changes
          group_by: day
          environment_tiers:
            - staging
          period_limit: 30
query.metric
Use query.metric to define the DORA metrics to query.
Supported values:
-
deployment_frequency(default) lead_time_for_changestime_to_restore_servicechange_failure_rate
query.group_by
Use query.group_by to define the X-axis of your chart.
Supported values:
-
day(default): Group data per day. -
month: Group data per month.
query.period_limit
Use query.period_limit to define how far the metrics are queried in the past (default: 15). The maximum period is 180 days or 6 months.
query.environment_tiers
Use query.environment_tiers to define an array of environments to include the calculation.
Supported values:
-
production(default) stagingtestingdevelopmentother
projects
Use projects to limit where issuables are queried from:
- If
.gitlab/insights.ymlis used for a group’s insights, useprojectsto define the projects from which to query issuables. By default, all projects under the group are used. - If
.gitlab/insights.ymlis used for a project’s insights, specifying other projects does not yield results. By default, the project is used.
projects.only
Use projects.only to specify the projects from which issuables
are queried.
Projects listed in this parameter are ignored when:
- They don’t exist.
- The current user doesn’t have sufficient permissions to read them.
- They are outside the group.
Example:
monthlyBugsCreated:
  title: "Monthly bugs created"
  description: "Open bugs created per month"
  type: bar
  query:
    data_source: issuables
    params:
      issuable_type: issue
      issuable_state: opened
      filter_labels:
        - bug
  projects:
    only:
      - 3                         # You can use the project ID
      - groupA/projectA           # Or full project path
      - groupA/subgroupB/projectC # Projects in subgroups can be included
      - groupB/project            # Projects outside the group will be ignored
Complete insights configuration example
.projectsOnly: &projectsOnly
projects:
only:
- 3
- groupA/projectA
- groupA/subgroupB/projectC
bugsCharts:
title: "Charts for bugs"
charts:
- title: "Monthly bugs created"
description: "Open bugs created per month"
type: bar
<<: *projectsOnly
query:
data_source: issuables
params:
issuable_type: issue
issuable_state: opened
filter_labels:
- bug
group_by: month
period_limit: 24
- title: "Weekly bugs by severity"
type: stacked-bar
<<: *projectsOnly
query:
data_source: issuables
params:
issuable_type: issue
issuable_state: opened
filter_labels:
- bug
collection_labels:
- S1
- S2
- S3
- S4
group_by: week
period_limit: 104
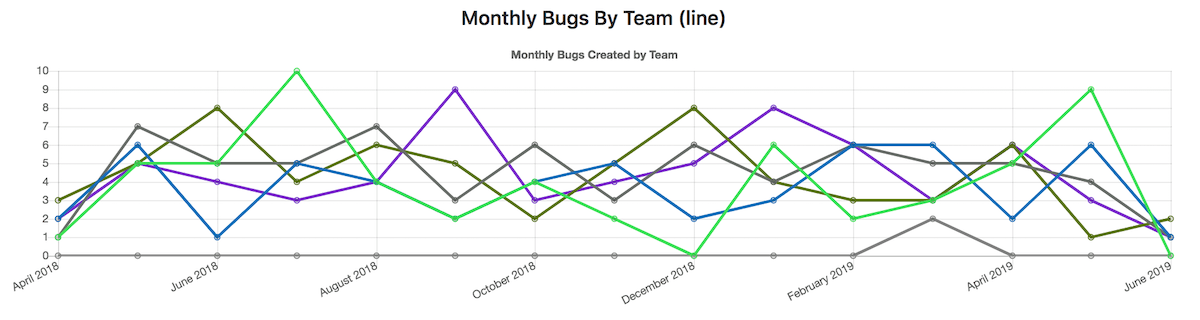
- title: "Monthly bugs by team"
type: line
<<: *projectsOnly
query:
data_source: issuables
params:
issuable_type: merge_request
issuable_state: opened
filter_labels:
- bug
collection_labels:
- Manage
- Plan
- Create
group_by: month
period_limit: 24