Observability for stage groups
Observability is about bringing visibility into a system to see and understand the state of each component, with context, to support performance tuning and debugging. To run a SaaS platform at scale, a rich and detailed observability platform is needed.
To make information available to stage groups, we are aggregating metrics by feature category and then show this information on dashboards tailored to the groups. Only metrics for the features built by the group are visible on their dashboards.
With a filtered view, groups can discover bugs and performance regressions that could otherwise be missed when viewing aggregated data.
For more specific information on dashboards, see:
- Dashboards: a general overview of where to find dashboards and how to use them.
- Stage group dashboard: how to use and customize the stage group dashboard.
- Error budget detail: how to explore error budget over time.
Error budget
The error budget is calculated from the same Service Level Indicators (SLIs) that we use to monitor GitLab.com. The 28-day availability number for a stage group is comparable to the monthly availability we calculate for GitLab.com, except it’s scoped to the features of a group.
To learn more about how we use error budgets, see the Engineering Error Budgets handbook page.
By default, the first row of panels on both dashboards shows the error budget for the stage group. This row shows how features owned by the group contribute to our overall availability.
The official budget is aggregated over the 28 days. You can see it on the stage group dashboard. The error budget detail dashboard allows customizing the range.
We show the information in two formats:
- Availability: this number can be compared to GitLab.com overall availability target of 99.95% uptime.
- Budget Spent: time over the past 28 days that features owned by the group have not been performing adequately.
The budget is calculated based on indicators per component. Each component can have two indicators:
-
Apdex: the rate of operations that performed adequately.
The threshold for “performing adequately” is stored in our metrics catalog and depends on the service in question. For the Puma (Rails) component of the API, Git, and Web services, that threshold is 5 seconds when not opted in to the
rails_requestsSLI.We’ve made this target configurable in this project. To learn how to customize the request Apdex, see Rails request Apdex SLI. This new Apdex measurement is not part of the error budget until you opt in.
For Sidekiq job execution, the threshold depends on the job urgency. It is currently 10 seconds for high-urgency jobs and 5 minutes for other jobs.
Some stage groups might have more services. The thresholds for them are also in the metrics catalog.
-
Error rate: The rate of operations that had errors.
The calculation of the ratio happens as follows:
\frac {operations\_meeting\_apdex + (total\_operations - operations\_with\_errors)} {total\_apdex\_measurements + total\_operations}Check where budget is being spent
Both the stage group dashboard and the error budget detail dashboard show panels to see where the error budget was spent. The stage group dashboard always shows a fixed 28 days. The error budget detail dashboard allows drilling down to the SLIs over time.
The row below the error budget row is collapsed by default. Expanding it shows which component and violation type had the most offending operations in the past 28 days.
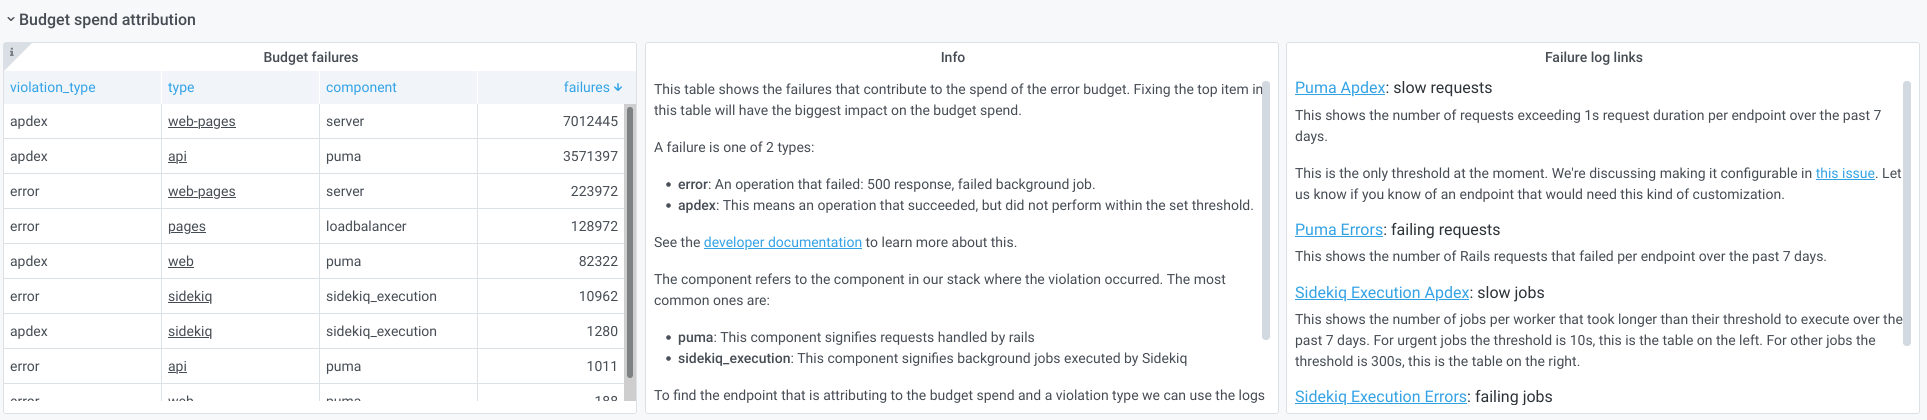
The first panel on the left shows a table with the number of errors per component. Digging into the first row in that table has the biggest impact on the budget spent.
Commonly, the components that spend most of the budget are Sidekiq or Puma. The panel in the center explains what different violation types mean and how to dig deeper in the logs.
The panel on the right provides links to Kibana that should reveal which endpoints or Sidekiq jobs are causing the errors.
To learn how to use these panels and logs for determining which Rails endpoints are slow, see the Error Budget Attribution for Purchase group video.
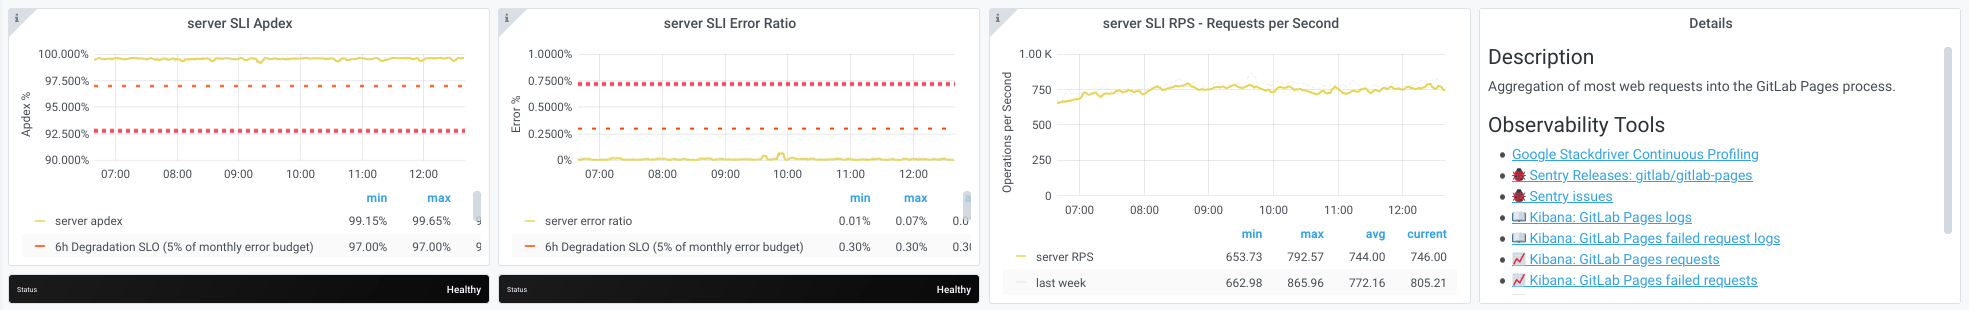
Other components visible in the table come from service-level indicators (SLIs) defined in the metrics catalog.
For those types of failures, you can follow the link to the service
dashboard linked from the type column. The service dashboard
contains a row specifically for the SLI that is causing the budget
spent, with links to logs and a description of what the
component means.
For example, see the server component of the web-pages service:
To add more SLIs tailored to specific features, you can use an Application SLI.